Distributed Tracing with Sleuth & Zipkin: The Digital Breadcrumbs
Master observability in microservices. Learn how to track requests across distributed boundaries using Spring Cloud Sleuth and Zipkin to eliminate 'The Latency Mystery'.
Distributed Tracing with Sleuth & Zipkin: The Digital Breadcrumbs
"In a monolith, you have a stack trace. In microservices, you have a mystery."
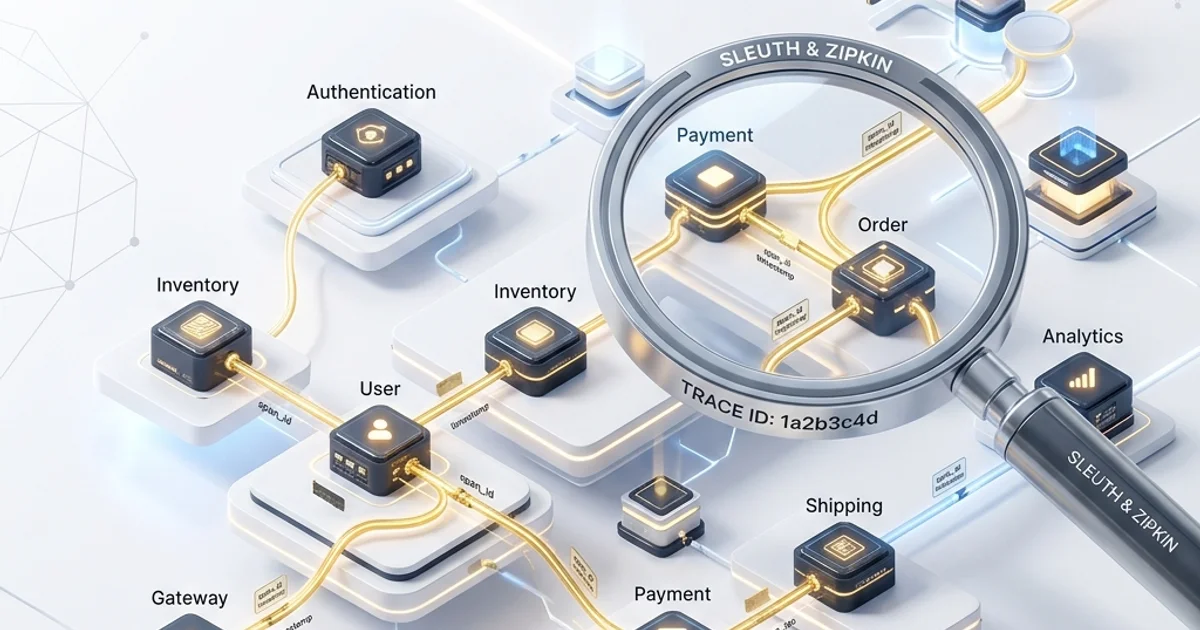
Imagine a user clicks "Buy Now." The request hits the Gateway, then the Order Service, then the Inventory Service, then the Payment Service, and finally the Email Service. If the request takes 5 seconds to complete, where was the bottleneck? Was it a slow SQL query in Inventory? Was it a network retry in Payment?
Without Distributed Tracing, you are guessing. With Spring Cloud Sleuth and Zipkin, every request is assigned a unique Trace ID that follows it across the network, leaving a trail of "Breadcrumbs" that tell you exactly where the time was spent.
1. The Anatomy of a Trace: Spans and IDs
Distributed tracing relies on two core concepts: Traces and Spans.
Trace ID
A unique 64-bit or 128-bit identifier assigned to the entire request path. Whether the request hits 1 or 100 services, the Trace ID stays the same.
Span ID
Represents a single "Unit of Work" (e.g., an HTTP call, a database query, or a method execution). A single Trace is made up of many Spans.
- Parent Span: The caller.
- Child Span: The work triggered by the caller.
B3 Propagation
Sleuth (now integrated into Micrometer Tracing) uses headers like X-B3-TraceId and X-B3-SpanId to pass these IDs over the wire (HTTP, Kafka, or RabbitMQ). This ensures that when Service B receives a call from Service A, it knows it is part of the same story.
2. The Hardware-Mirror: The Tax of Observation
From an architectural standpoint, tracing is not "Free." It follows the Hardware-Mirror principle: observability is a resource management tradeoff.
The I/O Cost of Tracing
Every time Sleuth creates a Span, it generates data (metadata, timestamps, tags).
- NIC Overhead: Passing tracing headers increases the size of every packet. While
128bits is small, across1,000,000requests, this adds megabytes of "Observation Noise" to your network fabric. - CPU Context Switching: Every Span start/stop requires a system clock read. In high-frequency trading or sub-millisecond systems, the act of "Looking at the clock" can actually slow down the execution.
- The Zipkin Storage Tax: Zipkin receives these spans via HTTP or Async (Kafka/RabbitMQ). Collecting and indexing millions of spans requires significant high-IOPS disk storage (Elasticsearch or Cassandra).
Hardware-Mirror Rule: For high-traffic production systems, Never use 100% sampling. Use Probabilistic Sampling (e.g., sample 1% of requests). This provides a statistically significant picture of your system's health without melting your hardware under the weight of its own monitoring data.
3. Zipkin: The Visualization Engine
While Sleuth captures the data, Zipkin is the dashboard that visualizes it. It converts the raw JSON spans into a "Gantt Chart" style view.
Key Metrics in Zipkin:
- Service Dependency Graph: An automatically generated map of which service talks to which.
- Critical Path Analysis: Identifying which span in the chain is the "Longest Pole in the Tent."
- Clock Skew Correction: Zipkin automatically adjusts for slight time differences between physical hardware nodes to ensure the trace looks chronological.
4. Implementation: Traceability in 5 Minutes
Integrating Sleuth and Zipkin in Spring Boot 3+ requires the Micrometer Tracing bridge.
Maven Dependencies
<dependency>
    <groupId>io.micrometer</groupId>
    <artifactId>micrometer-tracing-bridge-brave</artifactId>
</dependency>
<dependency>
    <groupId>io.zipkin.reporter2</groupId>
    <artifactId>zipkin-reporter-brave</artifactId>
</dependency>
Configuration (application.yml)
management:
  tracing:
    sampling:
      probability: 0.1 # Sample 10% of requests
  zipkin:
    tracing:
      endpoint: "http://zipkin-server:9411/api/v2/spans"
5. Log Aggregation: The MDC Power
The most powerful feature of Sleuth is Log Correlation. Sleuth automatically injects the traceId and spanId into the MDC (Mapped Diagnostic Context) of your logging framework (Logback/Log4j2).
Without Tracing Logs:
[OrderService] Processing order 123
[PaymentService] Credit card declined
With Sleuth Logs:
[OrderService, a1b2c3d4, e5f6g7h8] Processing order 123
[PaymentService, a1b2c3d4, i9j0k1l2] Credit card declined
Now, if you search your Centralized Log Explorer (ELK/Grafana Loki) for a1b2c3d4, you see the entire journey of that specific user request across every log file in the cluster. This turns a multi-hour debugging nightmare into a 5-second search query.
6. Real-World Case Study: The "Intermittent Lag"
A financial platform was reporting that 1 out of every 1,000 transactions took 15 seconds instead of 200ms.
The investigation:
- Logs showed no errors. CPU usage was normal.
- Sleuth + Zipkin revealed the truth: The
Traceshowed14.8 secondsspent in theExternalSecurityService. - The Hardware Reality: The
ExternalSecurityServicewas running on a legacy VM that performed "Stop the World" Garbage Collection for15 secondsoccasionally. - The Fix: Instead of auditing our whole code, we simply added a Resilience4j Time Limiter (Module 37) to the security call and scaled the Security VM.
Without distributed tracing, we would have spent weeks refactoring the wrong services.
Summary: Master of the Breadcrumbs
- Trace Everything: Even if you don't use Zipkin, the Log Correlation alone is worth the price of admission.
- Respect the Tax: Use sampling to protect your hardware from "Observation Fatigue."
- Correlation is King: Link your logs, metrics, and traces with the same IDs.
- Visualize the Chaos: Use Zipkin to identify the "Service Dependency" map you didn't know you had.
You are now one step away from completing the microservices triad. We have configuration, discovery, and observation. The final gatekeeper is the API Gateway.
Frequently Asked Questions
Q: What is distributed tracing and why is it essential in microservices?
In a monolith, a request follows a single call stack you can trace in logs. In microservices, a single user request may traverse five services. Distributed tracing assigns a unique traceId to each request and a spanId to each service call within it. Every service propagates these IDs in headers. You can then reconstruct the full call chain, see exactly where latency was introduced, and identify which service caused a failure - without distributed tracing, debugging cross-service issues is largely guesswork.
Q: What is the difference between Spring Cloud Sleuth and Micrometer Tracing?
Spring Cloud Sleuth was the original distributed tracing abstraction for Spring Boot 2.x, automatically injecting trace context into logs, HTTP headers, and messaging. In Spring Boot 3.x, Sleuth was replaced by Micrometer Tracing, which provides the same auto-instrumentation through Micrometer's observation API. The concepts are identical; the dependency coordinates changed. If you are on Spring Boot 3, use micrometer-tracing-bridge-brave or micrometer-tracing-bridge-otel instead of Sleuth.
Q: How do I reduce the volume of traces sent to Zipkin in production?
Use sampling. Set management.tracing.sampling.probability=0.1 to sample 10% of requests. For low-traffic services, 100% sampling is fine. For high-traffic services, a 1-10% sample still gives you sufficient data to identify patterns while reducing storage costs. For critical transactions (payments, order creation), use a Sampler bean to force sampling to 100% regardless of the global rate.
Part of the Java Enterprise Mastery - engineering the observation.